 South Africa
 Namibia


David Knee
Co-Deputy Chief Investment Officer, Fixed Income (M&G UK)
Market Observations: Q3 2020
The Coronavirus pandemic continued to dominate global headlines in the third quarter (Q3) of 2020, with many countries battling a second wave of infections amid the ongoing re-opening of economies. Financial markets were generally positive across both equities and bonds, helped by ongoing supportive monetary and fiscal policies, although the gains were far lower than the exceptional rallies seen in Q2. Rising risk-off sentiment in September saw some earlier quarterly gains being retraced. Underpinning market sentiment were rising hopes of the development of an effective vaccine by early 2021, the further opening of markets and an acceleration in trade, as well as improving economic indicators in the largest economies. However, weighing on sentiment were troubling accelerations in infections in key European countries like the UK and France, where stricter lockdowns had to be re-imposed, and the failure by the US to stop the spread of the pandemic in the lead-up to the Presidential election on 3 November. During the quarter the IMF did not revise its projected 4.9% contraction in global growth for 2020, saying it expects the recovery to be “long and bumpy”.
South African financial markets were marginally positive over the quarter, helped by higher commodity prices. This was despite the country posting a shocking 51% q/q contraction in GDP in Q2 2020, worse than market estimates of a 47.3% decline. GDP is now expected to contract by 8.2% in 2020, before rebounding by 3.9% in 2021 and 2.6% in 2022.
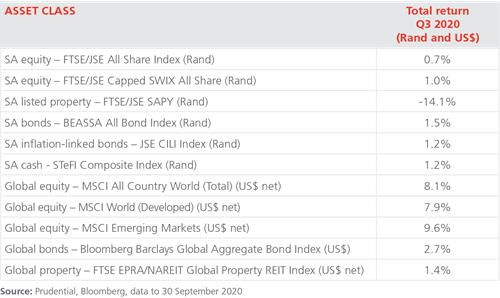
As shown in the table, in US$ terms, global equities (the MSCI All Country World Index, ACWI) returned 8.1% for the quarter, as developed markets delivered 7.9% and emerging markets produced 9.6%. For SA investors, the rand’s 3.9% appreciation against a weaker US dollar trimmed offshore investment returns somewhat. Global bonds delivered 2.7% for the quarter and global property returned 1.4% (both in US$). Central banks generally kept interest rates at very low, accommodative levels, and governments continued to enact fiscal support packages for consumers.
In the US, it was reported that GDP contracted by 31.4% q/q in Q2 2020 following a 5.0% contraction in Q1, with the second quarter being the hardest hit by the pandemic lockdowns. The latest estimates show the economy is expected to shrink by 3.7% in 2020 before rebounding by 4% in 2021, but, more positively, the economy added 1.4m jobs in August and the unemployment rate fell to 8.4%.
At its August policy meeting the US Federal Reserve left the benchmark interest rate unchanged at near 0%, adding that it now expected rates to remain around zero for the next three years. It also said it would continue to buy back bonds to support the economy. The US dollar continued to weaken against other major currencies as the government grappled with high budget deficits and a failure to contain the pandemic. In the equity market, the S&P 500 gained 8.9% in US$ for the quarter, while the Nasdaq was up 12.6%, giving it a total return for 2020 so far of 31.7%.
In the UK, sentiment was subdued as the government failed to make progress with its Brexit negotiations, sparking more talk of a “no deal” Brexit and its negative consequences. Equally, a return to more strict lockdown measures in some cities caused concerns that growth would suffer more than expected. The UK’s GDP contracted by 19.8% q/q in Q2 2020, the largest quarterly contraction on record.
Like the US, the Bank of England and European Central Bank (ECB) maintained record-low interest rates and supportive bond buying programmes, with the ECB pledging to buy up to EUR1.35trn worth of debt through June 2021 under the Pandemic Emergency Purchase Programme. Meanwhile, Euro area unemployment rose to 7.9% in July from 7.7% previously, and the area recorded an 11.8% q/q contraction in GDP. In the equity markets, the FTSE 100 returned 0.4% in US$ for the quarter, while Germany’s DAX produced 8.2% and the French CAC 40 delivered 2.3% in US$.
In Japan, Prime Minister Shinzo Abe, the country’s longest-serving leader, announced his surprise resignation for health reasons in September, and was replaced by his chief cabinet secretary and expected successor, Yoshihide Suga. Markets took this in stride as Suga is widely expected to continue with Abe’s economic policies. Japan’s GDP shrank by 7.9% q/q in Q2 2020, marking the third consecutive quarter of contraction and the steepest on record. The Nikkei 225 returned 7.0% for the quarter.
Meanwhile, China’s economic data continued showing signs of further economic acceleration, with manufacturing activity, industrial output, services and exports continuing to expand. The country reported 3.2% y/y GDP growth for Q2 2020, rebounding from a record 6.8% y/y contraction in Q1 and recovering earlier than other large economies due its earlier reopening. At the same time, Hong Kong financial markets were in the red following the authorities’ quick moves to arrest and prosecute local pro-democracy protesters under the territory’s strict new security law. Hong Kong’s Hang Seng Index returned -2.6% for the three months and the MSCI China returned 12.6% in US$.
Among other large emerging equity markets, in US$ terms the MSCI India was the quarter’s strongest performer with a 15.1% return, followed by South Korea’s KOSPI at 13.6%, the MSCI China with 12.6% and the MSCI South Africa at 3.7%. Lagging were the MSCI Turkey with a -15.6% return and Brazil’s Bovespa with -3.1% (both in US$).
The price of Brent crude oil ended the quarter at around US$42.50 per barrel, very near where it started. The price remains under pressure from ongoing slow global growth and steady supply. As for other commodities, palladium was among the star performers over the period, gaining some 21.8%, while gold was up 6.5% and platinum rose 7.1%. Among industrial metals, copper rose 9.5%, aluminium increased 8.4% and nickel was up 12.5%.
South Africa sees tepid performance
Although the country experienced a slowdown in the spread of the Coronavirus and an accompanying acceleration in economic activity during the quarter, this good news was largely offset by weak economic indicators, poor company earnings reports and more load-shedding from Eskom to keep local financial markets and sentiment subdued.
Apart from the sharp 51% q/q contraction in GDP growth for Q2 2020, one of the most important indicators showed the country lost some 2.2 million jobs during the second quarter under the effects of the lockdown. The number of employed persons decreased by 2.2 million to 14.1 million versus the first quarter of 2020. However, this was not reflected in the unemployment rate, which actually improved due to a collapse in the number of people actively seeking work over the period.
At its policy meeting on 17 September, the South African Reserve Bank (SARB) announced a worsening growth outlook for the country, with GDP now expected to contract by 8.2% in 2020, compared to the -7.3% forecast in July. The SARB kept the repo rate unchanged at 3.5%, and its latest interest rate model forecasts no further changes over the near term. However, two rate increases are seen in the second half of 2021. This is in the face of a relatively benign inflation outlook: consumer inflation was largely steady at 3.1% y/y in August from 3.2% in July, and the SARB expects CPI to average 3.3% in 2020. Looking ahead, the SARB lowered its CPI forecasts to 4.0% in 2021 and 4.4% in 2022.
Also during the quarter, the SARB slowed its purchases of government bonds as local bond market liquidity continued to improve, buying only around R350m in August compared to an average of R10bn monthly in the first months of the programme, introduced in March.
The BEASSA All Bond Index managed to deliver 1.5% in Q3 2020; the yield curve steepened further as the shorter end continued to rally while longer-dated bonds weakened. SA inflation-linked bonds returned 1.2%, with the curve also steepening, and cash (as measured by the STeFI Composite) also produced 1.2% for the three-month period.
The local equity market finished in the black thanks solely to Resources stocks, with other sectors losing ground. The FTSE/JSE All Share Index (ALSI) returned 0.7% for Q3 2020. The Resources 10 Index returned 5.7%, Financials -1.6%, Industrials -2.3% and Listed Property (SAPY Index) was the poorest performer with -14.1%.
Finally, the rand put in a mixed performance in Q3, gaining 3.9% against a weaker US dollar but depreciating 0.5% against the pound sterling and 0.3% versus the euro.
How have our views and portfolio positioning changed?
Starting with our view on offshore asset allocation, during the quarter we added to global equities, moving back to an overweight position from being neutral in Q2. This was as the rand/US$ exchange rate became less undervalued, while adding to diversification in the portfolio and helping reduce SA-specific risks. We also bought US$ futures during the quarter, also to add to portfolio diversification and offset the SA-specific risk in the portfolio.
Within our global equity positioning, our portfolios continue to be underweight the more expensive US market in favour of selected European and emerging market equities. We have been aiming to position the portfolios with higher weightings of very high-returning global assets while maintaining a mix of assets that have diversified return profiles.
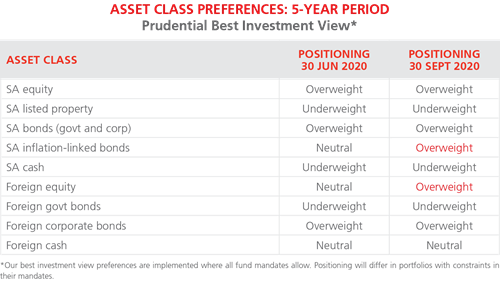
We remain underweight developed market government bonds, and overweight US and European investment-grade corporate bonds and selected emerging-market government bonds, which offer much more attractive real yields.
Our best investment view portfolios continue to be overweight SA equities. SA equity valuations as measured by the Price/Book value ratio of the FTSE/JSE Capped SWIX Index were trading at around 1.4X at the end of September, very similar to the level seen at the start of the quarter. This continues to be exceptionally attractive compared to the market’s long-term P/B average of around 2.1X.
Within SA equities we continue to prefer large, global companies that offer sound, high-quality diversification such as Naspers, British American Tobacco, Anglo American, Remgro and MTN. Implats is another overweight holding that has added to portfolio value so far this year. We have also maintained our overweight in the local banking sector, with exposures to Absa, Standard Bank and Investec given the attractive valuations they offer.
We have kept our substantially underweight positioning in SA listed property in our best investment view portfolios in Q3. This positioning reflects the significant uncertainty surrounding the outlook for the SA economy and property company distributions, as well as the relatively high debt levels in the sector. The risks around property company earnings remain high given the deterioration in the economic outlook, and as such we have ensured that we are holding high-quality companies with strong balance sheets within our small exposure to the sector, like Growthpoint.
During the quarter we maintained our overweight in SA nominal bonds in our best investment view portfolios, and continue to favour longer-dated maturities. As of 30 September, 10-year government bonds yields were still elevated compared to their history, offering around 9.6%, which equates to an after-inflation (real) yield of around 4.6% (assuming inflation of 5.0% over the next decade). This is substantially above our long-run fair value assumption of a 2.5% real yield. We believe these yields will more than compensate investors for the risks associated with the government’s precarious fiscal position and possible further credit rating downgrades.
We increased our exposure to inflation-linked bonds during the third quarter of 2020, buying shorter-dated (five-year) ILBs out of cash holdings to move to an overweight position. The gap between ILB and cash real yields continues to be very wide, with real yields on cash currently negative, while current ILB real yields of 0.9%–4.85% across the curve are also attractive compared to our long-run fair value assumption of 2.25%.
Lastly, cash is the one SA asset class where prospective returns have fallen sharply, due to the large interest rate cuts from the SARB. Our best investment view portfolios remain underweight SA cash, since prospective real returns from this asset class are negative.
Share
Did you enjoy this article?

 Get the Newsletter