 South Africa
 Namibia


Ross Biggs
CIO Equities
A closer look at SA vs global equities: Why opt for SA in volatile times?
At M&G Investments we have been communicating regularly about our preference for South African equities over global equities in our multi-asset portfolio asset allocation for some time now. This has been due to our local market’s inexpensive valuations largely compared to the US, which has been expensive and dominates the global benchmark MSCI All Country World Index (ACWI). As the US recovered far more quickly than the rest of the world from the Coronavirus crisis in 2020-2021, a wide valuation differential opened up between global equity markets and SA equities, and this gap has remained large ever since. As a consequence, we have remained overweight the SA market and are still overweight. This is based on our firm belief that with valuations as they stand currently, on a risk-adjusted basis SA equities still have a stronger likelihood of outperforming the US (and therefore global equities broadly) than underperforming it going forward.
In our view, the future performance of the SA equity market relative to the US or global markets is likely to boil down to two main factors: 1) relative starting equity valuations; and 2) the US dollar (USD) earnings growth of the SA equity market relative to a comparative global market such as the S&P 500, where USD strength also plays a role. Here we unpack these factors for a better understanding of our ongoing preference for SA equities.
1. Relative starting equity valuations
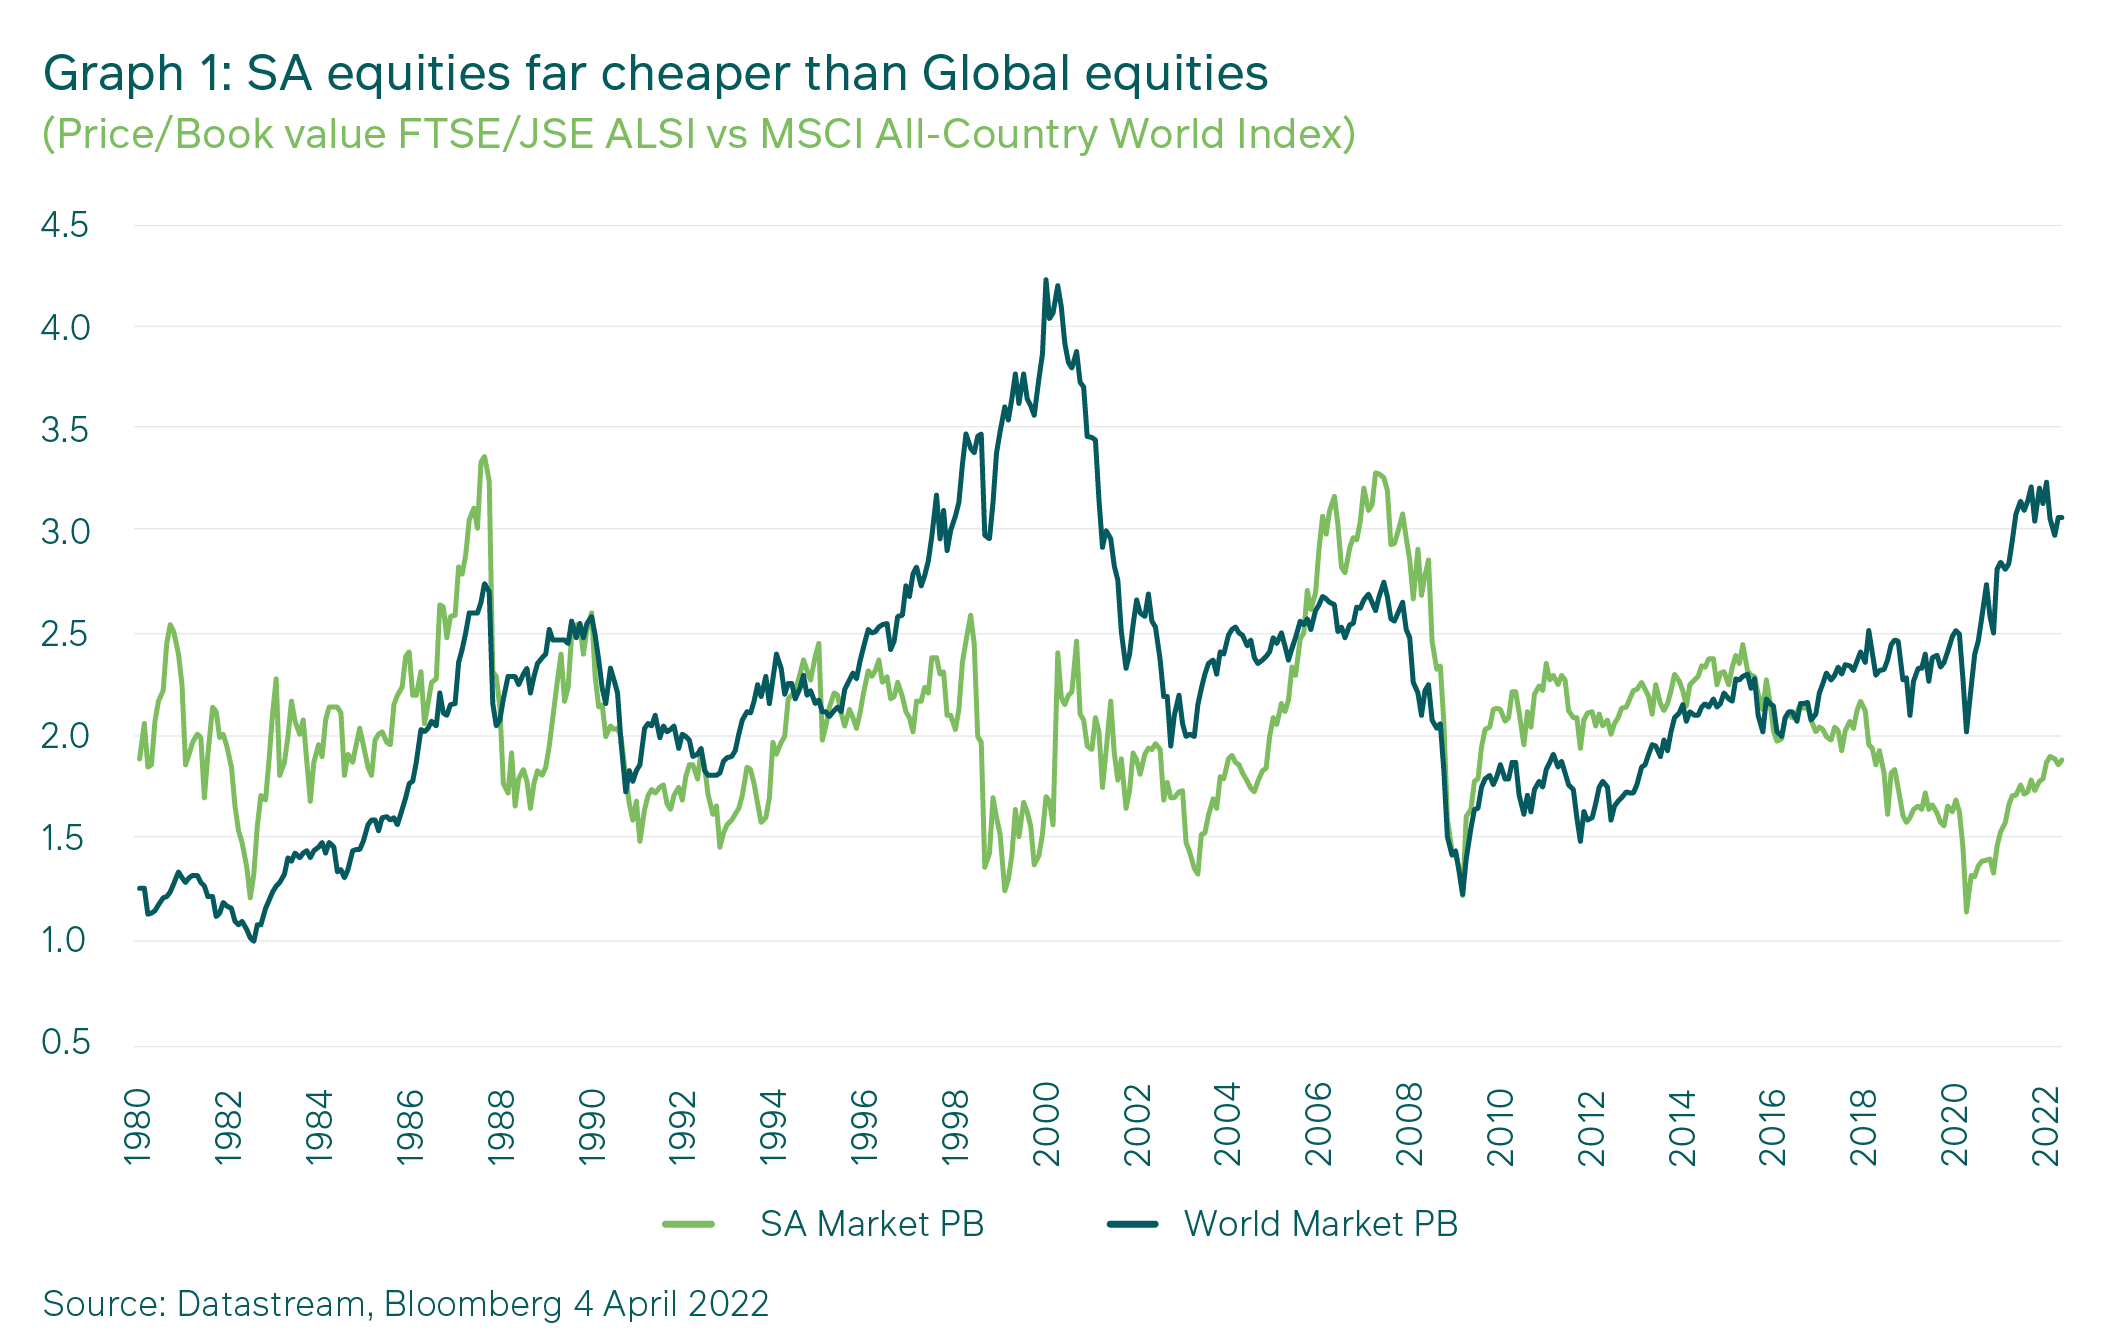
Going into the Coronavirus crisis, in our view South African equities were already undervalued, and they continue to trade at levels which we think are exceptionally attractive. The Price-to-Book value (P/B) ratio of the JSE was under 1.7X as at the end of April 2022, compared to its historic average of 2.1X. In our view this reflects excessive levels of pessimism in current share prices and valuations. Not only does this make us optimistic regarding SA equity returns over the medium term, but we also believe that there is an adequate margin of safety for many of the risks that the market is currently worrying about – namely, rising inflation, interest rates and subdued growth.
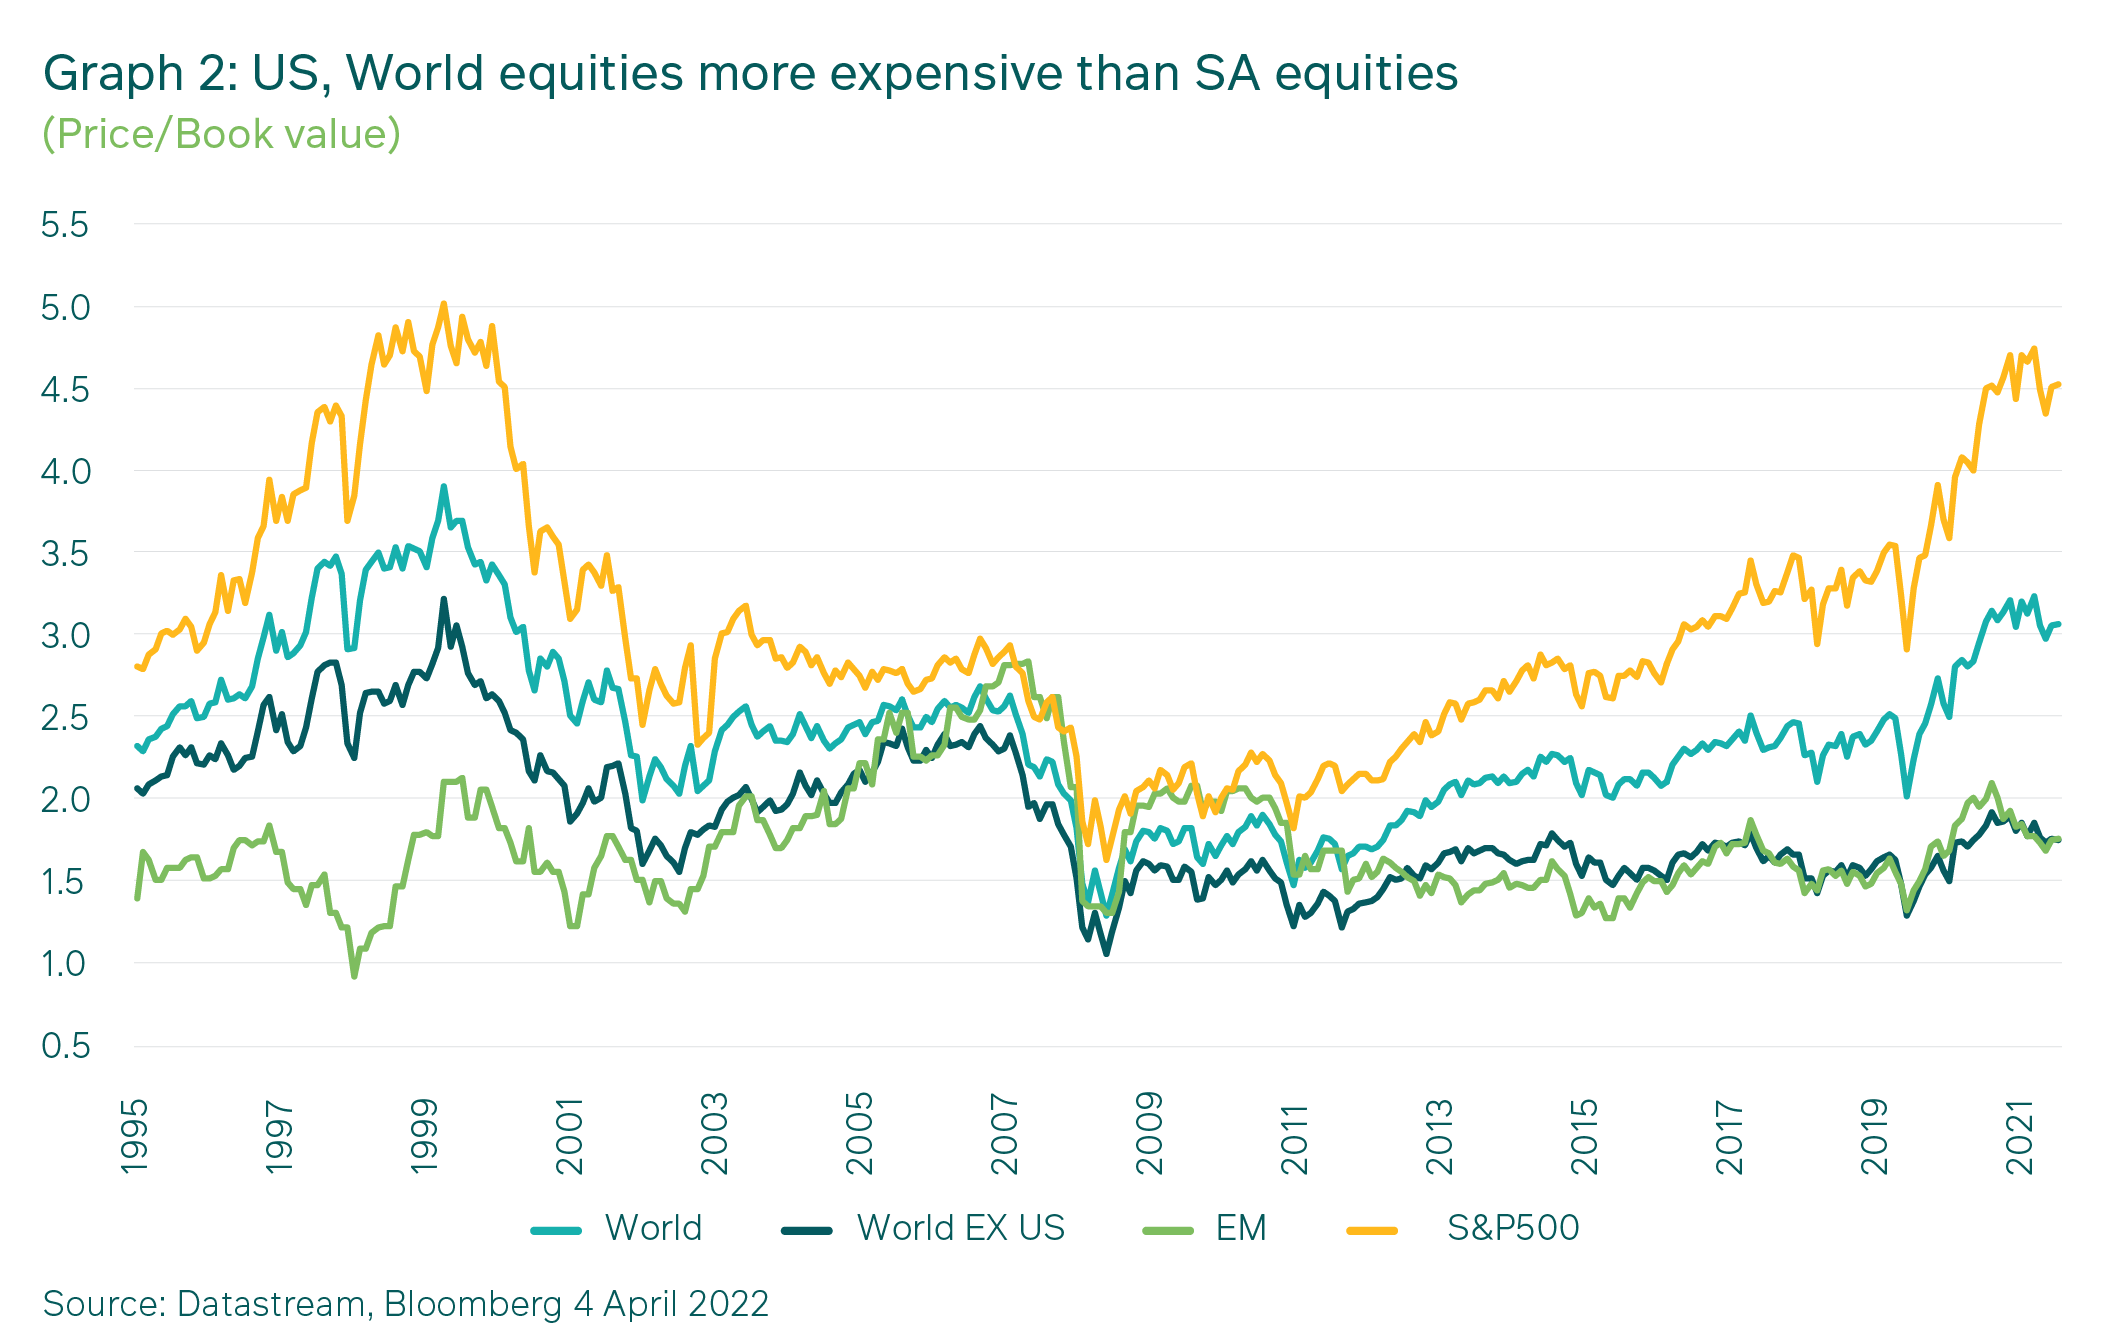
Graph 1 below highlights how much more expensive the valuation of the MSCI All Country World Index is, with a P/B ratio of around 3.0X, versus South African equities. Graph 2, meanwhile, shows that US equities, with a P/B ratio of around 4.5X, have clearly been the main driver of higher global asset valuations. Currently, South Africa, emerging markets (EM) and the World-ex-US all represent very good value relative to the US, which means that the odds of better future returns are against US equities and in favour of ex-US equity markets.
2. Relative SA earnings growth
Role of US dollar strength
It is worth pointing out that the US dollar has been exceptionally strong since the start of 2022. (appreciating by over 10% as measured by the DXY Index). This is partly due to its status as a safe-haven currency. More importantly, however, it has been relatively strong since the end of the Global Financial Crisis. Owning the S&P 500 over the last decade has been a winning trade, as not only have USD earnings been relatively strong compared to most other markets, but US equities have re-rated.
The question today is, which markets might outperform relatively in terms of USD earnings, and where are the most attractive relative starting valuations?
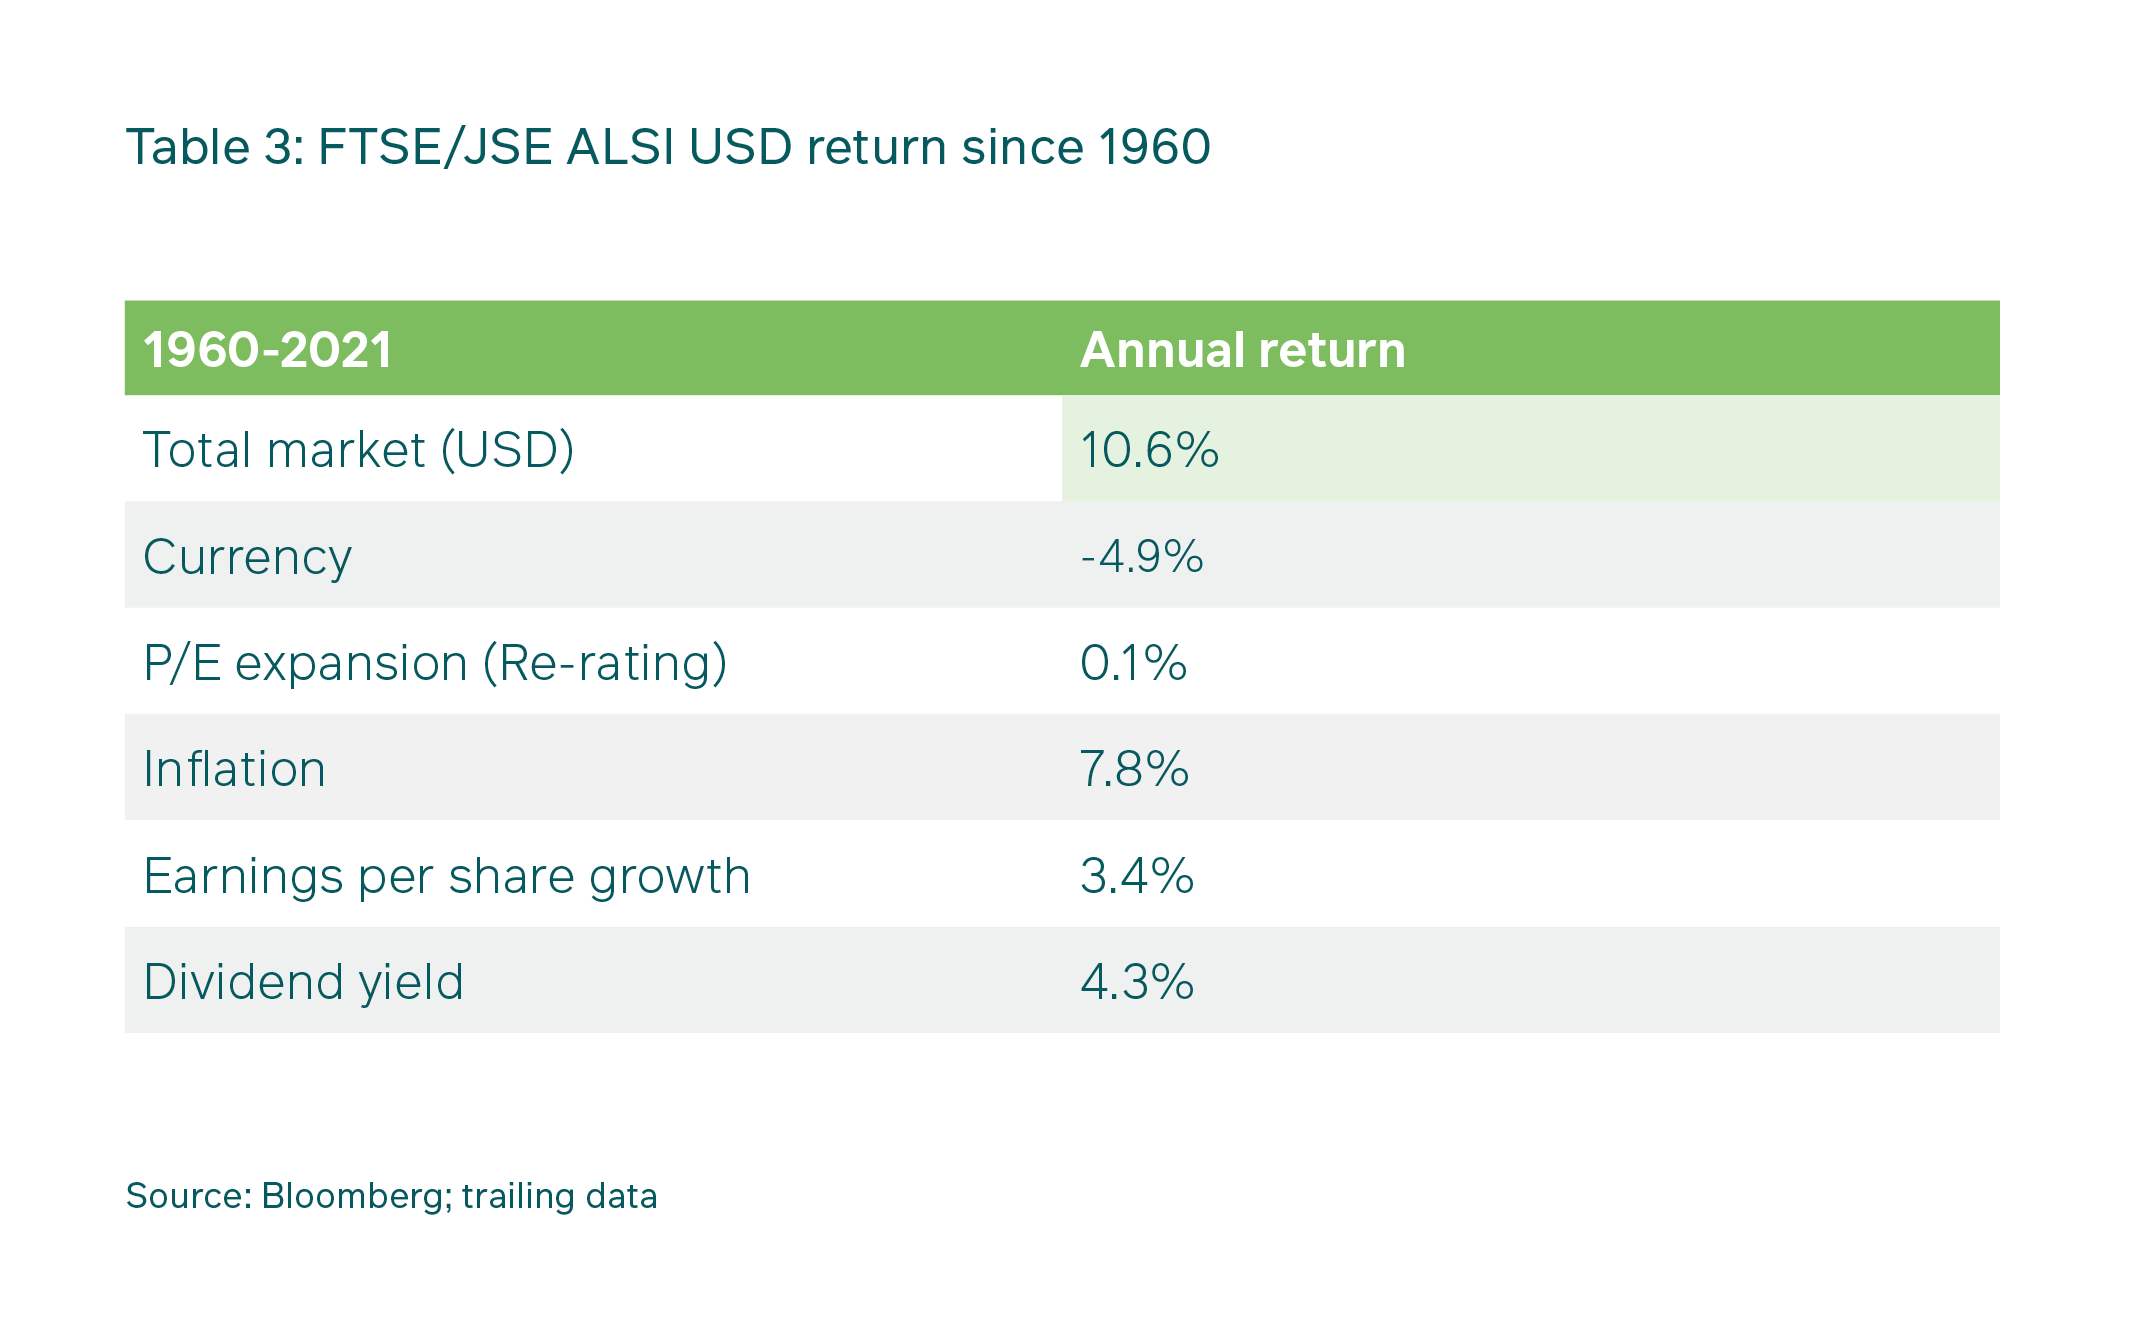
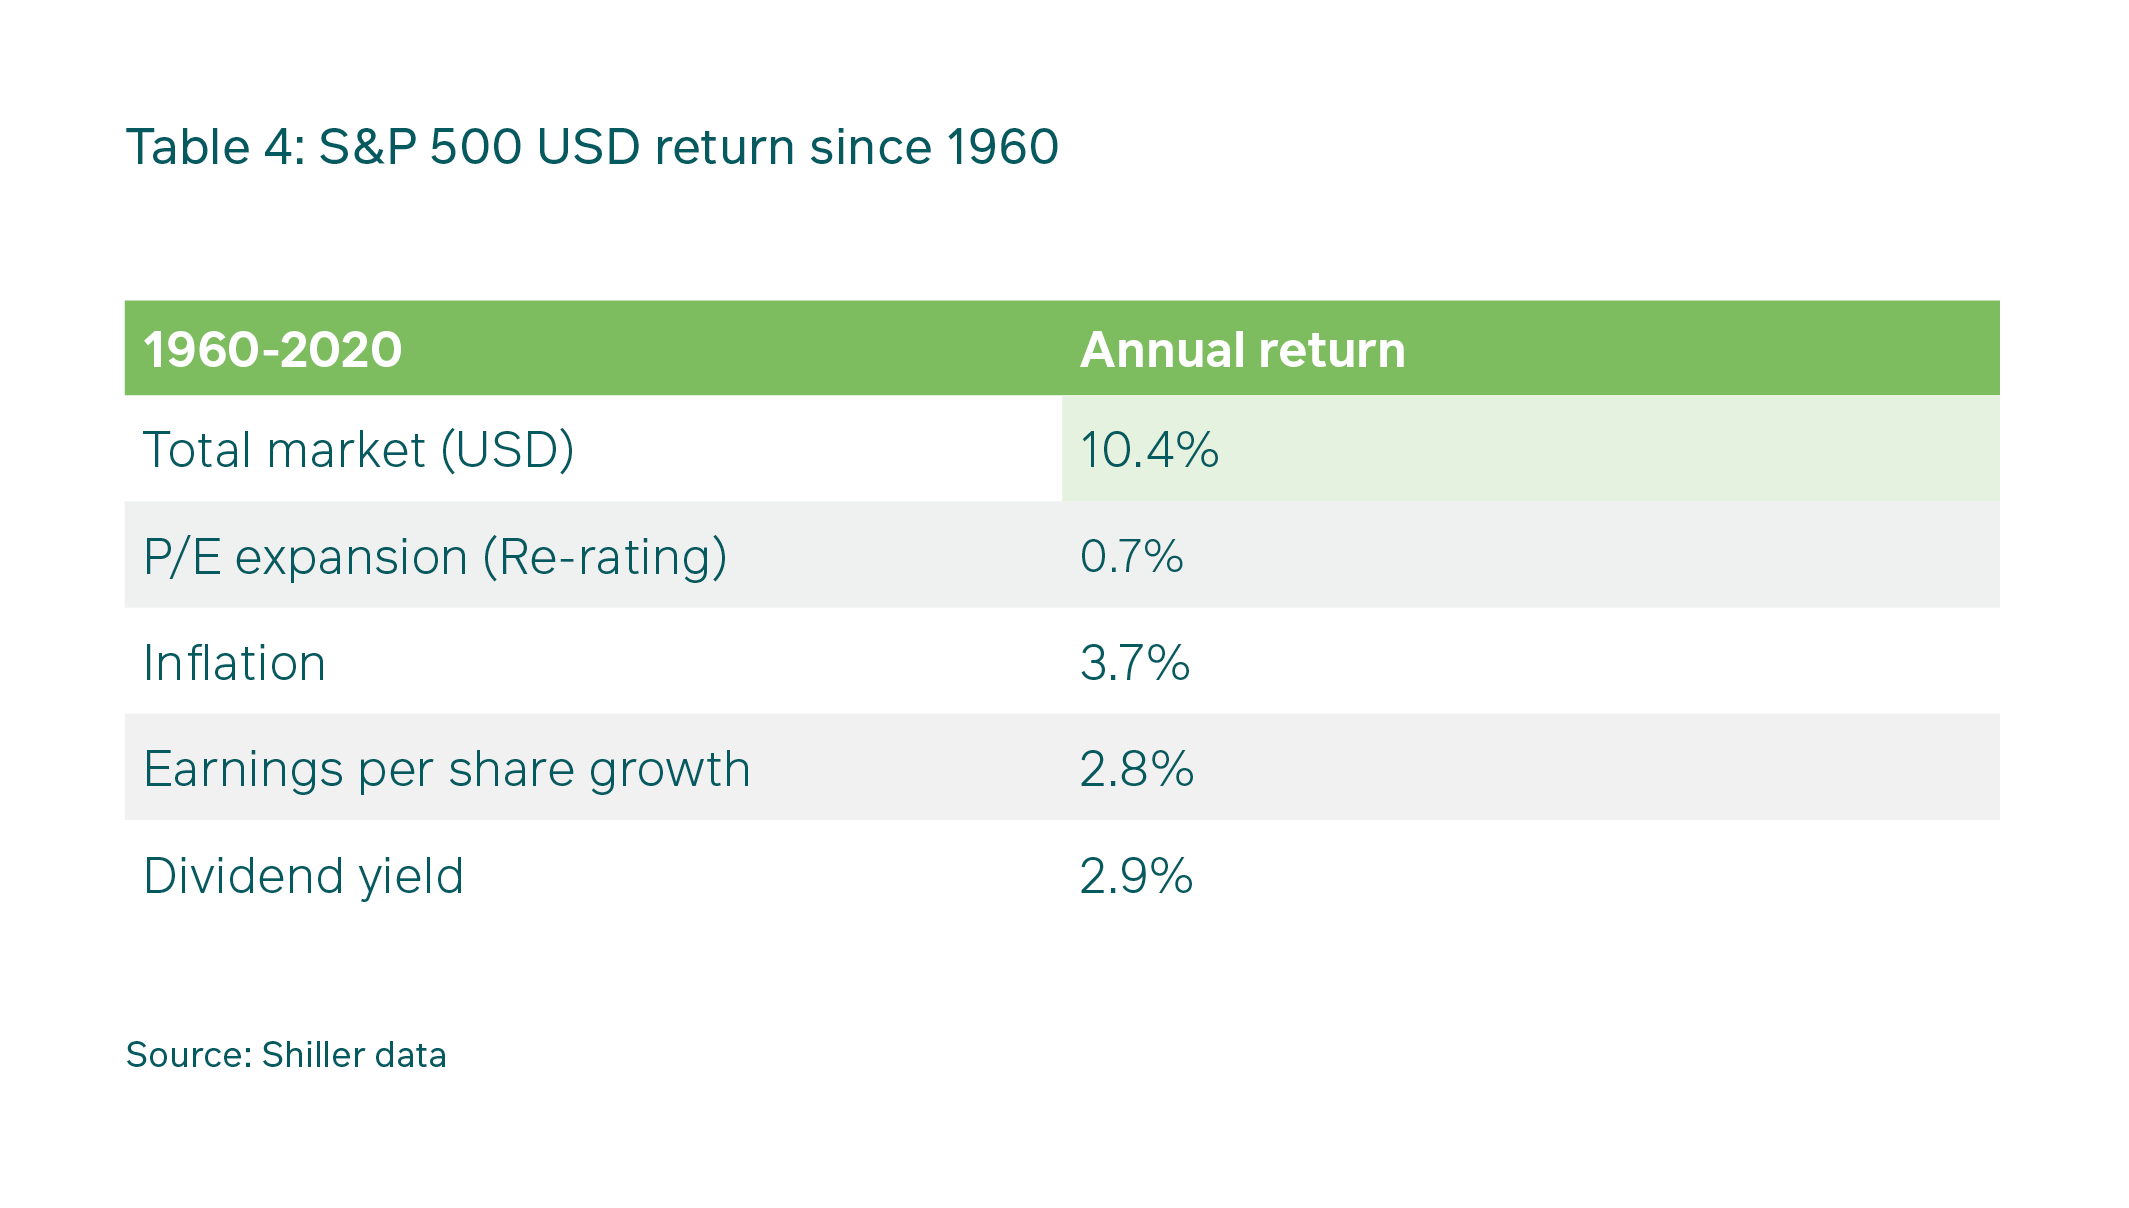
The USD earnings of the FTSE/JSE All Share Index (JSE) versus the US S&P 500 from 1960 through 2021 can be seen in Tables 3 and 4. Perhaps surprisingly for some, the JSE managed to deliver a slightly better return than the S&P 500 in USD over this 61-year period at 10.6% p.a. versus 10.4% p.a. And this came despite the JSE’s exceptionally poor relative underperformance of over 50% between 2011 and 2021. The JSE’s earnings have been stagnant in USD for over 10 years now, but have recently begun to move up. This lack of growth in USD earnings is likely one of the main reasons that South Africa has underperformed the US since 2010.
During threats of war and instability, such as the present, we would normally also expect the gold price to be seen as a safe-haven, but rising interest rates make gold less attractive and the dollar relatively more attractive. Equally, robust US economic growth relative to many other countries is also seen as a potentially comforting factor to investors. The strong dollar is having a different impact on many non-US countries. In our view, the countries or regions most at risk from USD strength, where earnings growth could be more impacted than others, are those emerging markets with high debt levels, and those which are importing ever-increasing inflation in the form of higher food and energy prices. Emerging market countries producing dollar-priced commodities (like South Africa) may be seen as relative beneficiaries of the strong dollar, although they are also likely to experience rising inflation and pressure on consumers. As always, investing is a relative game, and it is noteworthy that these large inflationary pressures and substantial relative currency movements may start to expose the weaker countries and regions.
It is worth looking at history to get a sense of relative earnings growth. Tables 3 and 4 below show the total market return in USD of an investment in the JSE since 1960, relative to the S&P500. 1960 was indeed a bad year for South Africa, with a dire social and economic outlook given the Sharpeville massacre. With this dire economic outlook and the formation of South Africa’s own currency, the rand, in 1961 (which at the time could buy around 1.5 US Dollars), one might have argued that the prospects for good relative USD returns from an investment on the JSE were poor.
The starting dividend yield of the JSE was 4.3% versus the S&P 500 at 2.9%. i.e., the JSE started on a cheaper valuation. The JSE also managed to keep up with the USD earnings growth of the S&P 500 over the period, delivering 6.3% growth (-4.9% + 7.8% + 3.4%) versus the S&P 500 at 6.5% (3.7% + 2.8%) -- and this again despite the substantial recent outperformance of the S&P 500 earnings relative to the JSE.
Conclusion
What this history shows us is that SA earnings growth is capable of keeping pace with the US market and slightly outperforming it, through different economic cycles, even with a depreciating currency and little to no price-earnings (P/E) re-rating.
To conclude, in our view, the SA market is pricing in far higher risk premia for SA equities currently than is merited by the likely outcomes for inflation, interest rates and growth. On both an absolute and a relative basis these valuations make it more likely that the JSE will be able to outperform the US equity market (and therefore the MSCI All Country World Index), as it has done before. We have been taking advantage of these cheap valuations to help ensure that our portfolios are well-positioned to deliver on their expected returns over time, and are confident that they will continue to do so going forward.
Share
Did you enjoy this article?

 Get the Newsletter