 South Africa
 Namibia


Aadil Omar
Head of Equity Research
What the rainforest teaches us about risk management
This article is from the Quarter 2 2020 edition of Consider this. Click here to download the complete edition.
As in nature where “survival of the fittest” is the law of the jungle, SA stock market returns also show how, over time, only a few companies succeed in thriving. Most produce below-average performance over time, observes Aadil Omar, Head of Equity Research.
Key take-aways
- Like the world’s rainforests, where a few tree species thrive but many dwindle, SA stock market returns exhibit high degrees of concentration. Over time, only a handful of stocks account for the majority of returns.
- Consequently, successful investors need to have exposure to some of these top-performing stocks, while also avoiding the many that underperform, by being able to distinguish the winners from the losers over the long term.
The Amazon rainforest is the most biologically diverse place on earth. Of all known species in the world, 1 in 10 are found in the Amazon basin. But of the thousands of tree species that dwell in the rainforest, only a few dozen seem to rule the jungle – these special plants have become colloquially known as “hyperdominant” trees.
Researchers mapping more than 16,000 tree species in Amazonia unexpectedly discovered that only 227 species, or 1.4%, made up nearly half of the 400 billion trees estimated to live there. In other words, there is significant concentration of biomass in favour of the hyperdominant trees at the expense of the rest. This theme of concentration is manifested across numerous forests, swamps, deserts and aquascapes.
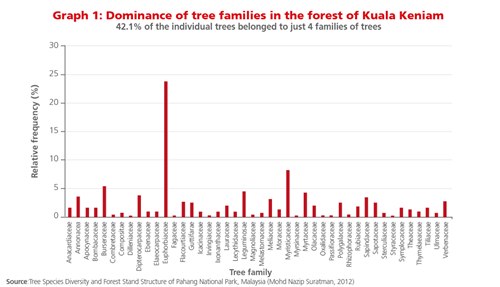
In another study illustrated in Graph 1, in the Malaysian rainforest of Kuala Keniam, 42.1% of the individual trees included in the study belonged to just four families of trees.
Financial markets also manifest high degrees of concentration
Although intriguing as a discovery, concentration is manifest across several natural and socioeconomic domains. Stock markets and returns attributable to individual stocks are quite pronounced in displaying high concentration, and the South African market epitomises this concentration well.
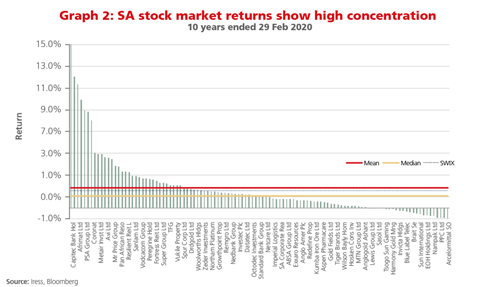
Despite overall anemic market returns over the past decade (especially the past five years), individual stock returns in the SA equity market have been widely dispersed. Graph 2 shows how only a handful of stocks have contributed the most returns since February 2010. Looking at the 111 stocks for which we have 10-year price return data reveals interesting (if not surprising) observations.
- The cumulative mean (average) return for the universe is 182%, while the median (the middle most number, in this case the return of the 56th stock in the universe when ranking from highest to lowest) is a significant 72% lower at 109%. This shows that there are a large number of poorly performing stocks driving down the median compared to the average. Alternatively put, there are relatively few strong-performing stocks bringing up the average return compared to the median.
- Only 35 of the 111 stocks (about 32%) have a return above the average of 182%.
- The four best-performing stocks, or 3.6% of the universe accounted for a quarter of the total return. The top 11 best-performing stocks (10% of the portfolio) accounted for a staggering 43% of the total return.
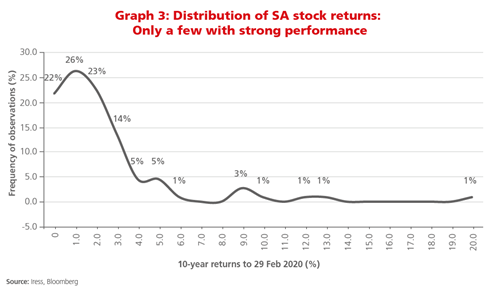
This result is shown as a return distribution in Graph 3, where we can see that there are dozens of poorly performing stocks to the left of the distribution curve, and these are offset by a handful of stellar performers to the right. The latter is called the “fat tail” of the distribution.
It’s probably safe to conclude not all returns can be viewed equally. These observations are not uncommon, and seem to hold over shorter time periods as well – we’ve tested both three- and five-year SA equity returns, and the overall concentration remains apparent. It is noteworthy that the concentration of stock returns across equity markets is indeed a global phenomenon (see, for example the academic study “Do Global Stocks Outperform US Treasury Bills?” by Bessembinder, Chen, Choi and Wei, 2019).
Expressed more conceptually, we learn that stock returns seem to embed the following characteristics:
- Market constituent returns are not normally distributed about the mean. There’s a popular narrative in equity market analysis that views stock returns as a linear function of the underlying market return. In other words, a stock’s return will move in a fixed fashion relative to the wider overall market return. This fixed measure is called a stock’s “beta” and indicates its volatility compared to the market. This framework is referred to as the capital asset pricing model (CAPM). However, despite widespread use of CAPM in equity analysis, stock returns over long periods of time do not seem to track linearly to market returns – at least not for significantly positive returns. Rather, they fluctuate over time.
- Return distributions are positively skewed: Positive skewness in distributions often implies that the mean of the distribution exceeds the median (as in the example of SA stocks), and that the mean can therefore be misleading as an indication of outcomes of more typical observations, by making it appear higher. For example, in a room of 10 people, 9 of whom have no wealth and 1 person is a billionaire, the average would be misleading because it would suggest everyone is worth at least R100 million.
It should also be noted that the distribution of returns model embeds survivorship bias: only those stocks that have survived the full 10 years are included. This likely overstates the mean return, as weaker companies that have gone bankrupt are excluded from the universe.
Equity markets (as measured by indices), and indeed the experience of SA equity investors, have been characterised by a concentration of returns and positive skewness. Looking back at the past 10 years, as an investor, if your returns were to keep up with the market average (let alone beat it), exposure to the better-performing stocks was essential. This observation might offer some assistance in explaining the collective underperformance of active managers relative to the market over extended periods of time. At least some fraction of underperforming active managers did not have sufficient exposure to the better-performing stocks.
Can trees teach us anything about stock picking?
In the Amazon rainforest, like many habitats in nature, some species become more prolific while others dwindle toward extinction. The ability to survive in a specific environment is what Charles Darwin referred to as “fitness”. And that’s the operative idea, “in a specific environment”.
Researchers are yet to conclude what makes any tree species hyperdominant. Intriguingly, hardly any of these species are consistently common across the rainforest. Each usually specialises in certain habitats – one or two types of forest for instance. One possibility is that the hyperdominant species are usually more resistant to disease-causing pathogens and herbivores. The hyperdominant trees effectively reduce their exposure to risk factors, while ordinary flora succumb to them, especially as they evolve over time. They are never quite able to thrive.
In any case, trees teach us that it would be wise to choose the most resilient in a given environment and avoid the least resilient. In other words, expose yourself to the winners while avoiding the losers – it seems pretty obvious.
Only, we can’t easily know what environment (or habitat) we’re likely to encounter, especially over the long term. This complicates the task of trying to choose the winners and avoid the losers.
What the rainforest teaches us about risk management
Hindsight is an intriguing quirk of human perception, often enticing us to believe that the way in which history would unfold was obvious at the time. It was not.
Foresight borders on the impossible in a complex system. And the world we live in engenders far more complexity that we’re prone to believe. The idea that one might be so astute as to successfully pick the multi-year winning stocks and have the conviction to hold those winners for the long term is aspirational. It is, however, not something we believe is consistently executable. Despite the innate protest to the contrary, we try reminding ourselves that the world is an utterly surprising place (as is the stock market as a socio-economic manifestation thereof). We have therefore built our investment process keeping this in mind
Many lessons can be drawn from this analogy of hyperdominant species in the Amazon rainforest, but we highlight the risk management system that underlies the thriving forest. The forest makes room for all species with the understanding that some will grow to be hyperdominant, while most will succumb to changing environmental hostilities. To ensure the forest thrives, it is necessary to be exposed to the potential hyperdominant species while allowing the weakest to be weeded out.
In managing equity portfolios, it is worth bearing the above in mind. Since there are often more stocks that dilute average returns (owing to positive skewness) than there are those that enhance them, managing exposure away from losers is essential. This is impossible with a passive or index-tracking approach.
At Prudential, we are deliberate about risk management; mitigating the impact of losing positions is often our first order of business. To quote an oft-repeated colloquialism of the investment industry, “Avoid the losers and the winners will take care of themselves”.
Share
Did you enjoy this article?

 Get the Newsletter