 South Africa
 Namibia


David Knee
Chief Investment Officer
SA investment returns: Better times ahead?
Article Summary
Prudential’s Chief Investment Officer David Knee examines prospective asset returns based on current valuations, where they’ve been and how they got where they are now.
Investors have been experiencing lower returns over most of the past five years across a broad range of South African and global assets. This, in turn, is prompting changes to asset allocation positions and investments that at Prudential we don’t believe are in their best long-term interests. Five years is certainly a long period of time; many would consider it around the typical length of an economic cycle and without doubt generally long enough for cheap valuations to tempt investors and consequently drive market prices higher. At Prudential we often tell clients that there is no relationship between valuations and market returns over 12 months, but that over three- and five-year periods this relationship becomes much stronger. So the question to ask is: “What’s gone wrong this time? Why haven’t equities delivered investors the 6-7% real returns that history suggests is the norm over longer periods?” And further, “What can we now expect over the next five years?”
A look back at the GFC and its aftermath
The answer, in large part, is to turn back the pages of time to the immediate aftermath of the Global Financial Crisis (GFC). No one would dispute there were cheap risk assets everywhere you looked in early 2009. We know this not because everyone was buying them then (they weren’t, they were worrying about the “end of capitalism as we know it”), but rather because those assets subsequently went up a lot in price - the market eventually confirmed their value. Everything is obvious when you look back, but far less clear in the heat of the moment. Hence, in 2009 the average Alexander Forbes Large Manger Domestic Balanced Fund had an equity exposure of 66%, down from over 73% in 2007, despite the fact that equity prices had fallen 25% over this period and were down 40% from their peak. Few managers were buying cheap but riskier equities, fearing the prospect of further substantial investment losses. Yet due to the Prudential investment process’ focus on buying cheaply valued assets, we added to our equity positions through the downturn, and felt thoroughly thrashed by March 2009. In hindsight we could have added more, but at least we held on to our overweight position and our process ensured that we didn’t capitulate.
Boom follows bust…
What happened next appears to have been broadly forgotten in the unhappiness of the past five years, but 2009 to 2013 was as close to investment Nirvana as most of us are likely to get in our lifetimes. Wherever you looked, markets shot up like satellites being delivered into space, with investors enjoying close to 20% annualized returns from risk assets, be that global equities, local equities or property. In South Africa, money poured into the multi-asset low equity sector, where real returns of 10-15% were extrapolated into the future. Some of these super-normal returns came about simply because assets were so cheap after the GFC. They had overshot to the downside as a result of investors panicking out during 2008, and so in March 2009 there was low-hanging investment fruit everywhere.
But some of these returns also came about as assets began to overshoot to the upside. Valuations started to become expensive. The story attached to this was that global interest rates were never going to rise. Easy money was here forever. Uber-low real interest rates lifted sustainable equity valuations, allowed governments to borrow more or less infinite amounts of debt at no cost, and implied that we had somehow entered a world where the link between growth, company earnings and returns had been broken to the benefit of asset holders.
…And bust follows boom
At Prudential we could see that by early 2013, markets had run too hard. We sought to explain to clients that some return had been borrowed from the future; that they shouldn’t extrapolate the returns they had enjoyed, and that returns from risk assets going forward would more likely be only high-single-digits. We were wrong about this; we were not negative enough. Returns in the five years to the end of 2018 have been mid-single digits. Equities and property have delivered about 5% per year since then, barely above inflation. Squaring the circle that is the difference between our expected returns five years ago and delivered returns is key to understanding the question of “where to from here?” When we consider the prospects for markets, we assume they will move gradually back to their long-term fair value. If, instead, they move not from expensive to fair but rather to cheap, then returns will be lower, which is what has happened. Effectively returns have now been ‘lent’ to the future just as they were in 2008.This cheapness is now available to investors who are prepared to take a medium-term view and to buy what might feel like the proverbial falling piano.
The SARB’s role
Perhaps one final comment on the last five years that is important relates to the Reserve Bank and monetary policy. Following the GFC, the South African Reserve Bank (SARB), along with the rest of the monetary world, slashed interest rates to assist in the recovery. Then-Governor Marcus more or less held real cash rates (the SARB’s repo rate less inflation) at around 0%. This was considerably higher than the US Federal Reserve or the Bank of England, where real cash rates dipped deeply in to negative territory, but nevertheless marked a seismic shift from the pre-GFC period when the average real cash rate in SA had been above 3%.This low level of real cash was one reason why in 2013, when Prudential set out our view of lower prospective returns, we didn’t slash our exposure to Property and Equity. Whilst these assets looked expensive against their history at the time, a high single-digit nominal return still looked decent against cash at just over 5%.
However, this shifted in 2015 when Governor Kganyago took over and instituted a policy of anchoring inflation expectations lower (targeting the 4.5% midpoint, instead of the 6% top, of the SARB’s 3%-6% range) by raising real cash rates to around 1.5%. This was still low by historical standards, but nevertheless a big shift from before. Higher real interest rates hurt bonds, property and equity, and thus added headwinds to a possible recovery in returns. The SARB therefore also played a role in the story we need to understand of how we’ve gotten to where we are now.
As an important aside, higher real interest rates did benefit one group of investors – those holding cash. So as riskier assets underperformed, investors started to move from bonds, equities and property into cash-related investments. The problem with this strategy is that it is impossible to know when cheap assets will deliver the superior returns that are on offer -- for many now in cash, the green light will only appear after cheap assets have already gone up a lot, at which point much potential value-add will have already vanished.
Current valuations and prospective returns
Prudential approaches the question of prospective returns not by trying to forecast the future, but rather by examining current market pricing and the returns implied by those prices. This is rather like trying to reassemble one of those ancient Greek urns where many of the pieces are missing. No one piece can ever provide the whole picture and some pieces will forever be missing (which should help explain why we also define ourselves as a risk-conscious asset manager, since from time to time, the missing pieces prove critical and no one idea or trade should destroy a client’s portfolio in our view), but overall we find we have sufficient pieces of information to skew the odds in our favour.
Many Prudential clients will be familiar with one piece common to all our urns, the cornerstone of our investment process which is the snapshot of real returns on offer presented in Graph 1. The bars represent the return we calculate is currently on offer (before inflation) for each asset. The circles are our view of a fair return for that asset. To the extent that the return on offer exceeds fair value then, from this piece of the puzzle at least, there is a potential investment opportunity.
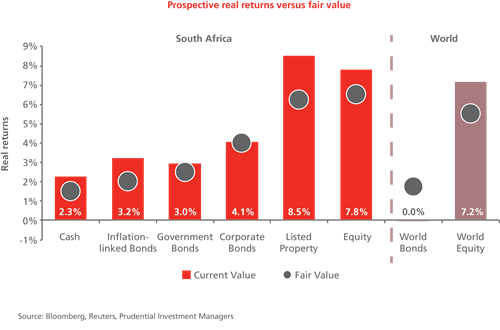
Attractive returns on offer from equity, property
Based on today’s valuations, in our view, Graph 1 shows there are no SA assets that are expensive – each shows a potential investment opportunity. Even investors in cash look set to enjoy returns of around 2% over inflation. But cash is no place to hide when the glory of 7%-plus real returns is on offer from equities and property. Bonds, especially long-dated nominal ones, also look enticing. Take a 20-year government bond at a nominal yield of 9.7%, deduct inflation at around 5.25% (we assume the SARB won’t entirely achieve its target of 4.5%) and a real yield of close to 4.5% is on offer. This might not seem much more than cash’s prospective 2% real return, but over 20 years, compounded at 2% per year, R100 turns in to a real R150, whereas at 4.5% R100 grows to a real R240, a 60% difference.
Our Prudential Inflation Plus and Prudential Balanced Fund have positioned themselves to benefit from these higher-returning assets. This might appear risky against what has just been delivered in the past five years, but in our view, the real risk is ignoring the superior returns now on offer over the next five years.
To find out more, speak to your financial adviser or contact our Client Services Team on 0860 105 775 or at query@prudential.co.za.
Share
Did you enjoy this article?

 Get the Newsletter